Once attendees start submitting their ratings, Eventify automatically builds a visual distribution chart for every star rating and emoji rating question in your form. You don't need to do anything to generate it — the chart updates in real time as responses come in, giving you an instant read on how each session landed.
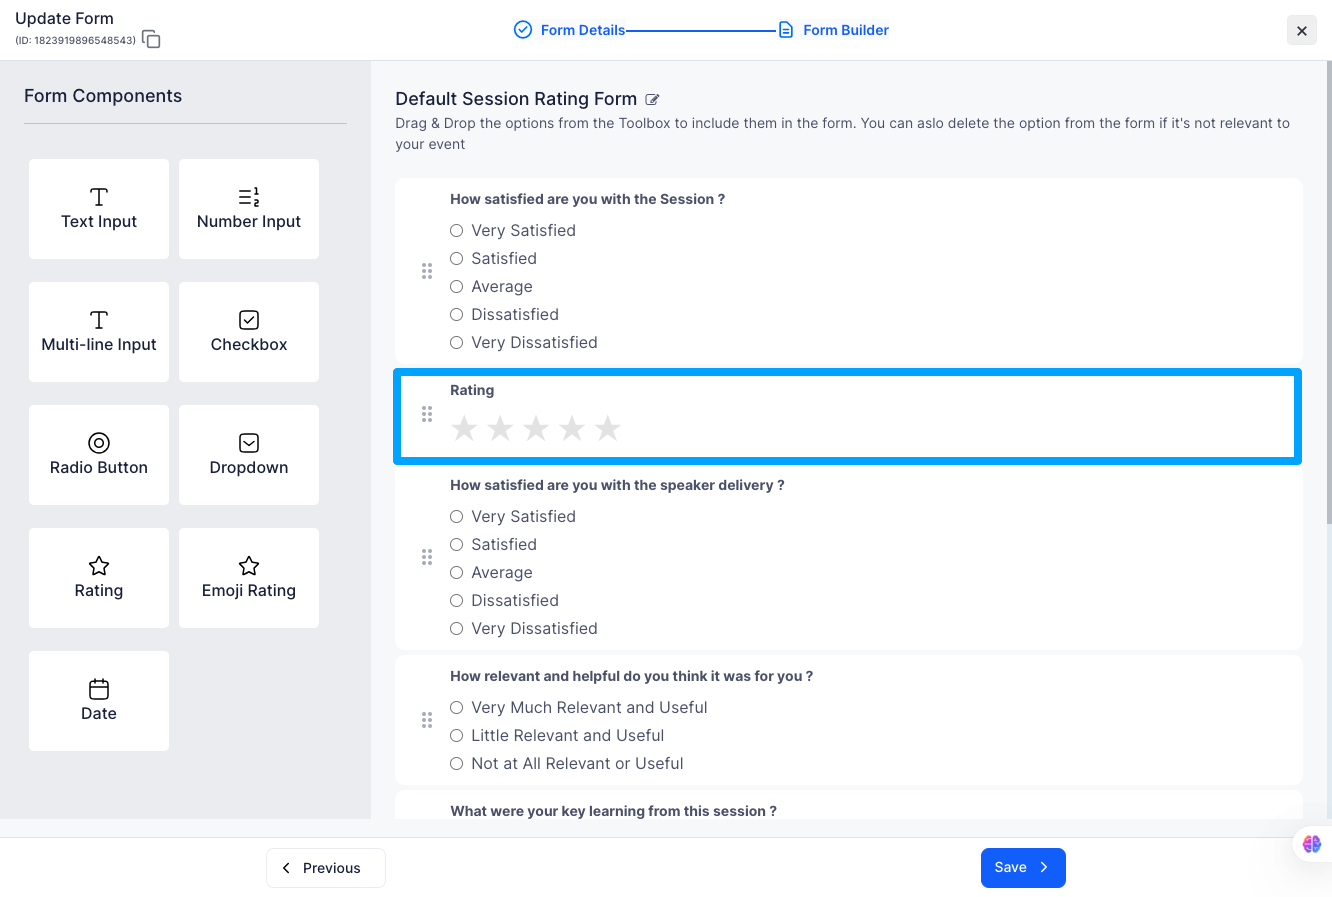
For star-type questions, you'll see 5 bars running from 1 Star at the bottom to 5 Stars at the top. Each bar shows the percentage of total responses that selected that option, and if you hover over a bar, a tooltip shows you the exact count behind that percentage.
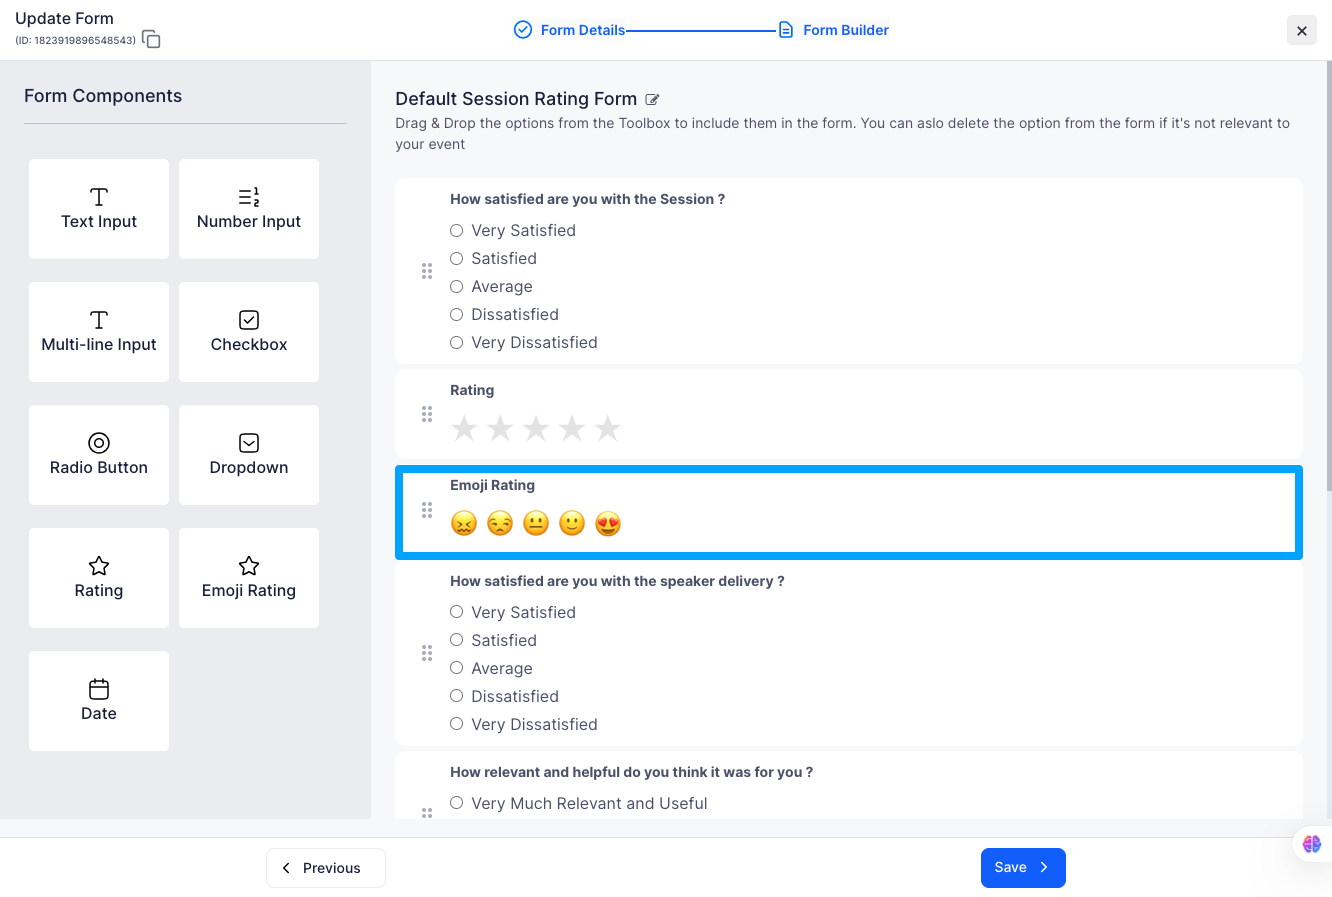
Emoji-type questions follow the same 5-bar layout, just with emojis in place of star numbers. From top to bottom: 😍 Love it, 🙂 Like it, 😐 Neutral, 😒 Dislike, and 😖 Hate it. The percentage and hover count work exactly the same way as the star chart.
Only star and emoji questions generate a distribution chart. If your form includes text inputs, dropdowns, checkboxes, or date pickers, those responses won't show up here — they'll appear in the Individual Responses table that sits below the chart section.
Q: The chart shows 0% for all bars — what's going on?
It just means no one has submitted a rating for this session yet. The chart updates automatically as responses come in, so check back once attendees have had a chance to rate.
Q: Can I see which attendee picked which rating?
Hovering over a bar shows you the total count for that option. For a full breakdown by attendee, scroll down to the Individual Responses table below the chart.
Q: My form has more than one star question — will each one get its own chart?
Yes. Every star or emoji question in your form gets its own chart block, displayed side by side so you can compare them at a glance.
